⚡The Onchain Economy is Like a Coiled Spring
Plus crypto fundamentals visualizations, ETH ETF inflows break records again, and the inevitability of crypto within the financial system
💡Dynamo’s Thoughts
The SEC?
Pivoting from attempting to crush the crypto industry to putting “all markets onchain.”
The White House?
Releasing 166 page reports arguing for the US to become a global leader in crypto.
Price?
Crashing.
Earlier this year, it wasn’t totally clear to what extent the US would pivot towards a more crypto-friendly stance and whether that would even be done in a way that would benefit the average onchain degen (as opposed to banks).
It looks increasingly likely that the onchain ecosystem is being set up to thrive.
“Project Crypto” from the SEC is an initiative to modernize securities rules and ‘shift markets on-chain’.
In case you missed the announcements, check out the highlights from the Dynamo DeFi team.
Here are a few important points from the SEC Chairman’s speech this week:
There are clear rules coming for ICOs and airdrops
Self custody is being protected
The SEC Chairman acknowledged that ambiguity around the Howey Rule has stifled innovation and promised to correct that.
Crypto tokens that are securities will have “purpose-fit disclosures, exemptions, and safe harbors”
That was just from the SEC. The White House released a lengthy report covering Digital Assets exclusively: the opportunity, the growth trajectory, and how the government will embrace, advance & support the technology.
Key members of the government are actively embracing the industry. One government projection has the stablecoin market growing 10x by 2028 to over $2T. Scott Bessent estimated nearly $4T by 2030.
Over half of Circle & Tether’s reserves are held in US Treasuries. If this growth plays out, the largest holders of US debt will be stablecoins. From that perspective, it’s clear to see why the government is interested in the tech.
But what does the market look like if there’s $3T of stablecoins onchain? What about when there’s an equal amount of liquidity unlocked from private equity and private credit? The world will need onchain businesses, payment applications, and easy access to DeFi & money markets.
Periodic speculative mania over the past 5 years has battle tested DeFi primitives and prepared them for this moment. Just as Bitcoin liquidity and stablecoin adoption are reaching escape velocity, regulatory conditions are being set up for entrepreneurs in the US to take full advantage of that. In essence the liquidity has entered the system to give the onchain economy a massive amount of potential. All it takes now is a nudge.
In this newsletter:
Dynamo’s Thoughts
Market Outlook
Market Health - as determined by metrics
Category & Chain Trends - which categories and chains are winning?
Onchain Metrics
Digital Asset Fundamentals
Onchain Highlights - Curated charts from the past week showing fast-growing DeFi protocols
🔭Market Outlook
Market Health
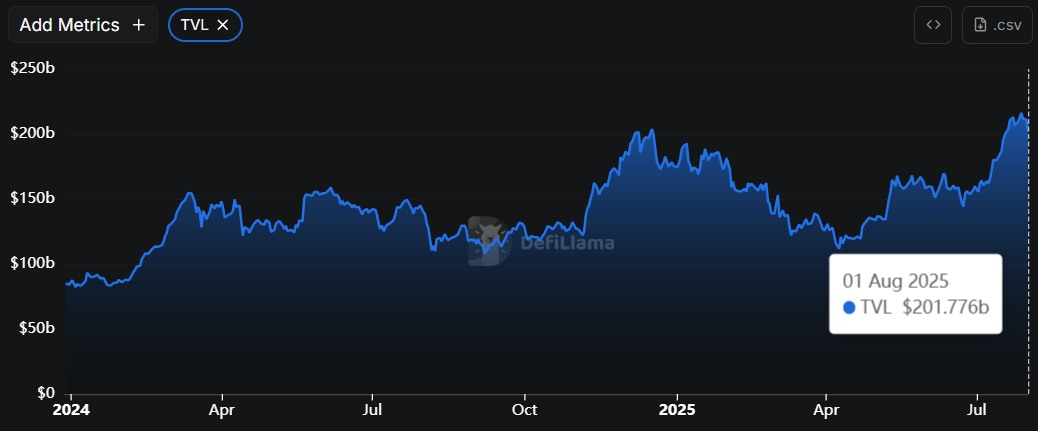
Total DeFi TVL
Total DeFi TVL pulled back from ATHs down to $201b.
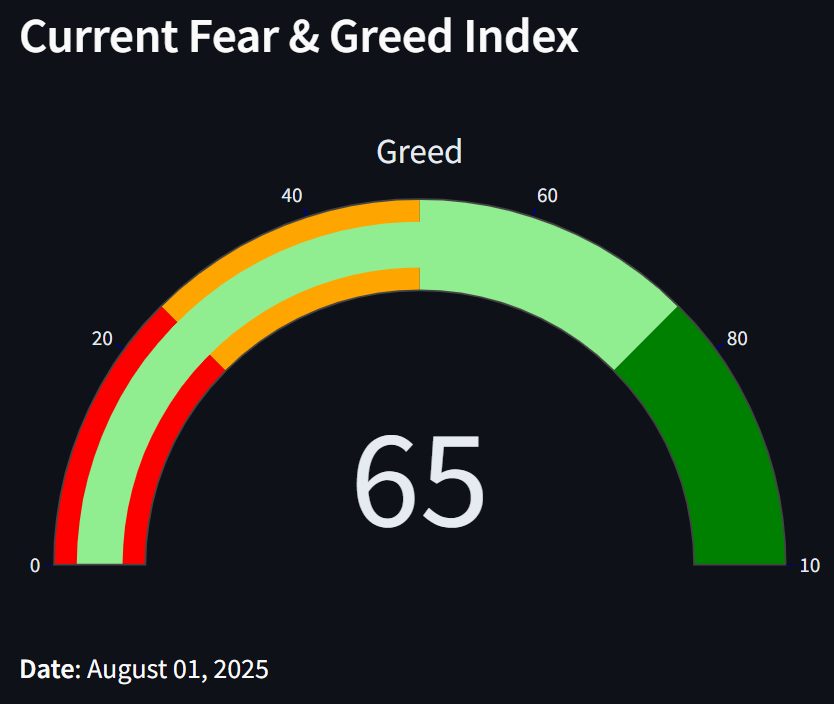
Fear & Greed Index
I created a website to track Fear & Greed with more detail. Check it out here. The index has fallen over the last few days and is at 65 today. We haven’t seen the index drop below 65 in well over a month, and it looks like we could drop below 65 if the market continues to pull back.
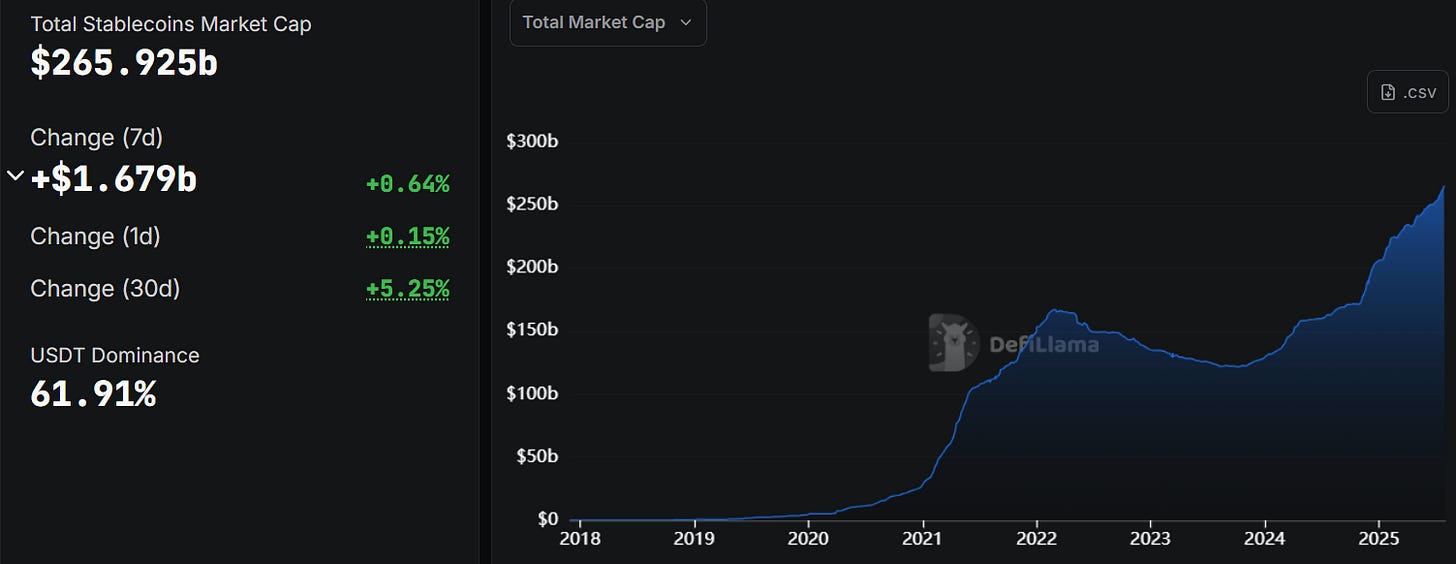
Stablecoin Market Cap
Stablecoin market cap added over $13b in the last 30 days - half of that came from USDT. Ethena’s USDe outpaced USDC growth: USDe grew $3.2b over the last 30 days while USDC grew $2.45b.
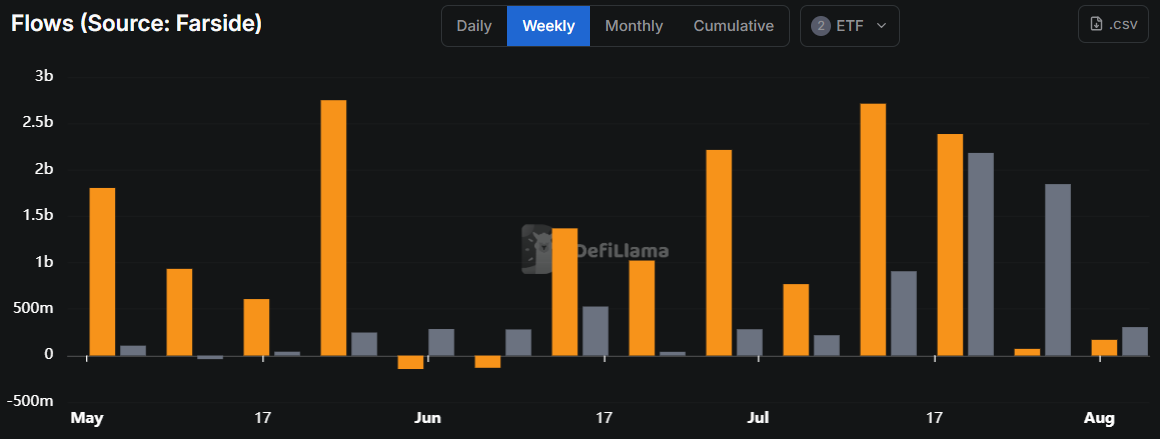
ETF Flows
In the last 2 weeks, BTC inflows have dropped dramatically while ETH inflows accelerate.
This resulted in July being a record month for ETH inflows, hitting $5.4b, more than double the previous record.
Ethereum ETFs now hold 4.87% of the ETH supply and are on a 20-day inflow streak.
IPOR Stablecoin Indices
The IPOR Index is a benchmark reference interest rate sourced from other DeFi credit protocols and is published onchain based on the heartbeat methodology.
Think of it like the LIBOR or SOFR in traditional finance. It’s a composite of the interest rates from multiple credit markets.
We can use these rates to indicate onchain leverage and activity.
USDC rates are rising, currently at their highest point since February. USDT rates are higher than last week, but not by much.
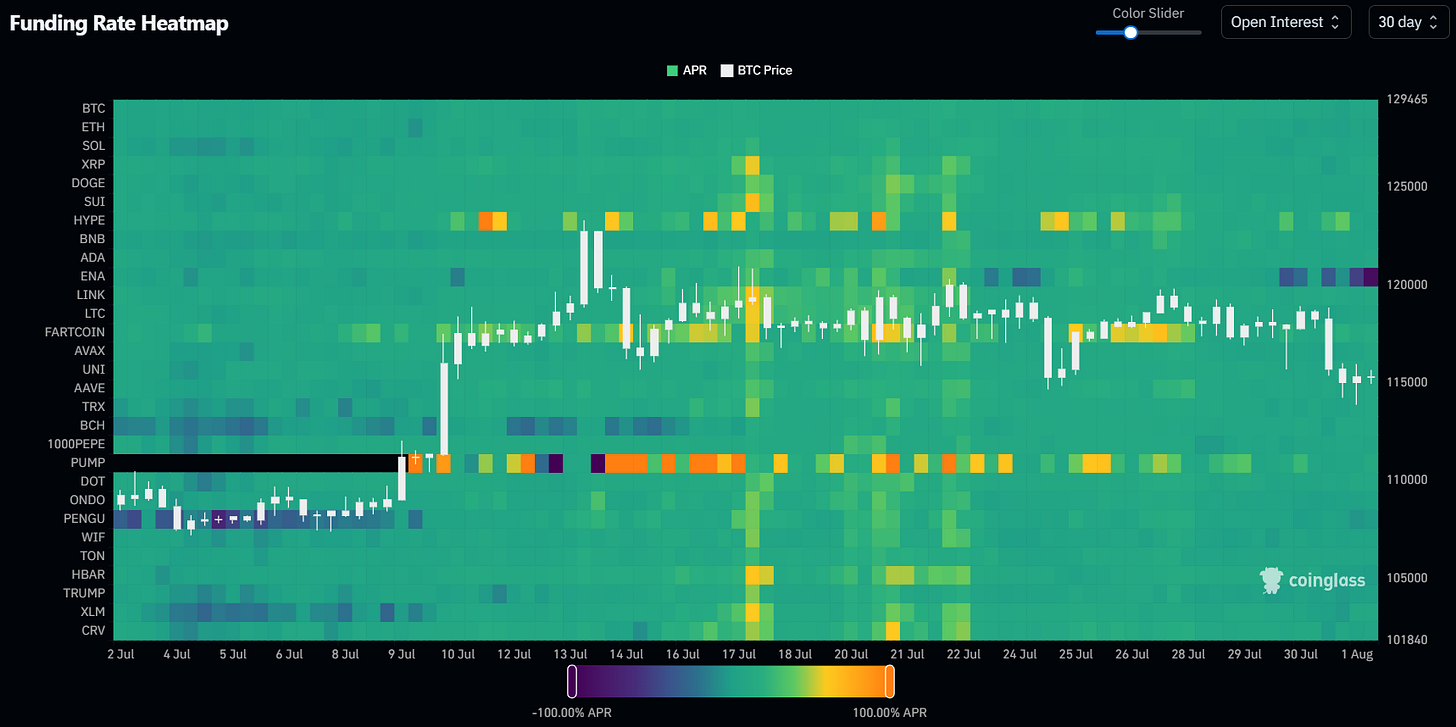
Funding Rate Heatmap
The Funding Rate Heatmap from Coinglass displays funding rates across some of the largest crypto assets.
Brighter colors indicate elevated funding rates for longs, and darker colors indicate low or negative funding rates (indicates large short positions).
Funding rates cooled off further from last week - ENA funding has gone negative.
Category and Chain Trends
Category TVL Changes
OTC Marketplaces grew 800% this week after Figure Markets Exchange was added to the category.
The story is similar for Decentralized BTC, with tBTC growing rapidly and the addition of YBTC.
Ethena leads growth in Basis Trading.
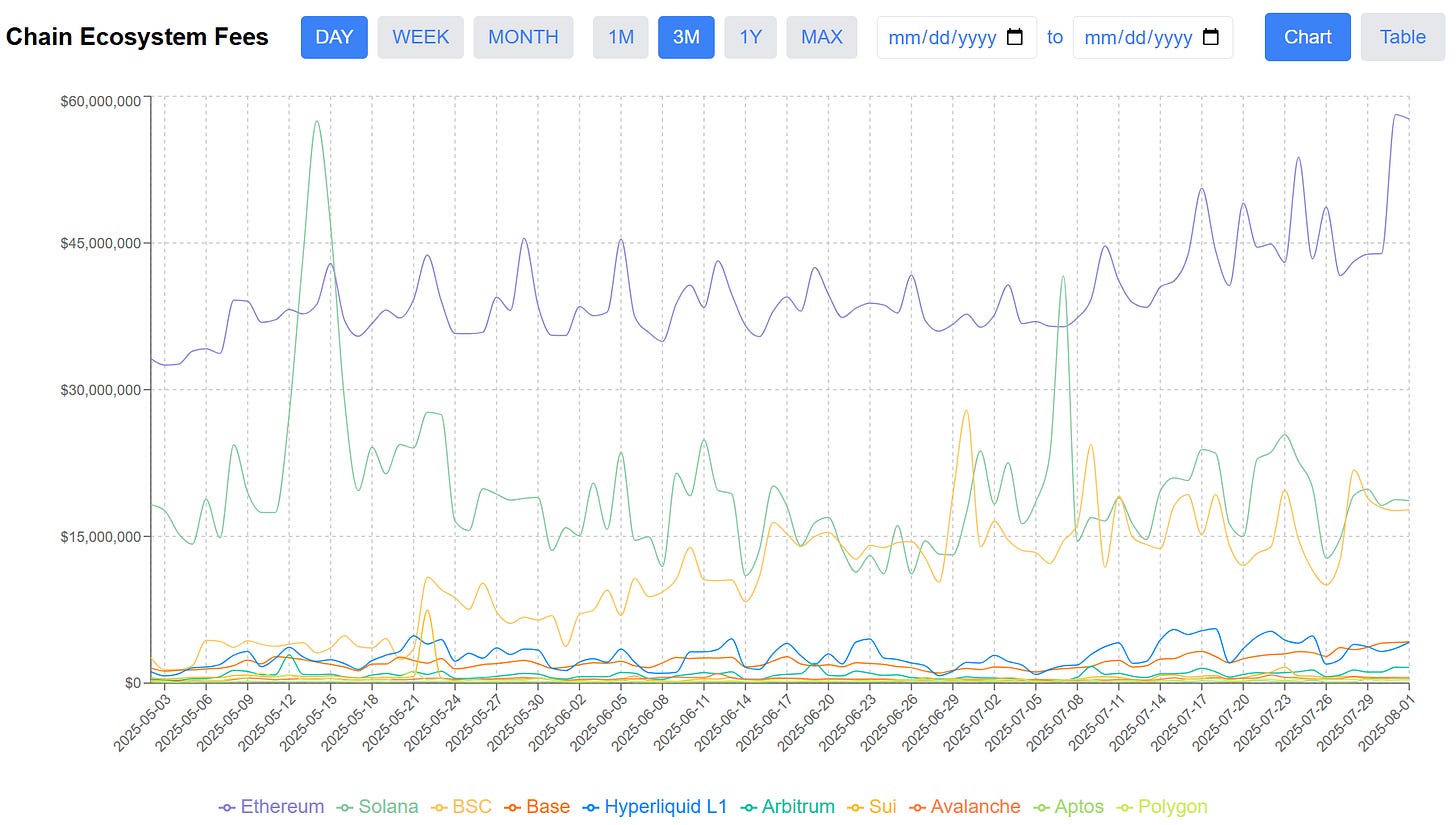
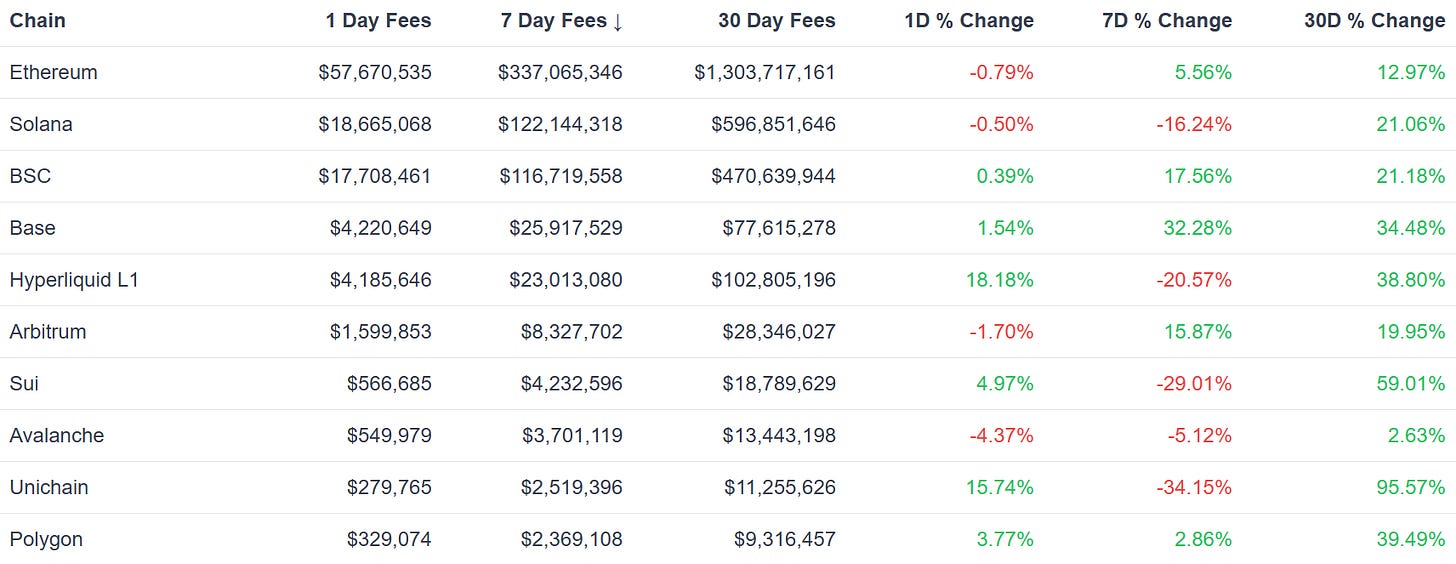
Chain GDP / Chain Ecosystem Fees
Chain GDP, also known as Chain Ecosystem Fees, measures the sum of fees spent on all applications on a chain.
I built a dashboard myself to show this over time by chain before it was available elsewhere: https://dashboard.dynamodefi.com/
Ethereum continues to trend upward, with 1d CEF hitting $58m, the highest level since December. On the weekly time frame, Ethereum just hit it’s highest weekly level ever, bringing in a record $337m in Chain Ecosystem Fees.
Base fees are up 30% this week, partially due to a burgeoning ecosystem alongside Zora.
Fastest Growing Chains ($100M+ TVL)
Bitlayer leads large chains for the second week in a row. Plume crossed $200m in TVL, with TVL nearly doubling in a month.
The story is similar for Katana, now at $336m.
Hyperliquid is among the top growers with liquid staking protocol Kinetiq crossing $800m in TVL.
Fastest Growing Chains ($10M-$100M TVL)
ZetaChain, Etherlink and IoTeX lead growth over the last 7 days.
On the monthly time frame, Story protocol TVL doubled.
📊Onchain Metrics
Digital Asset Fundamentals
We’re building out this section, where we dive deeper into the fundamentals behind digital assets with unique visuals to help you explore the intrinsic value of different tokens.
Below you’ll find 3 visuals:
Keep reading with a 7-day free trial
Subscribe to Dynamo DeFi to keep reading this post and get 7 days of free access to the full post archives.


